Story ideation
Note: For some of these examples such as chart generation, you need to be using ChatGPT-4
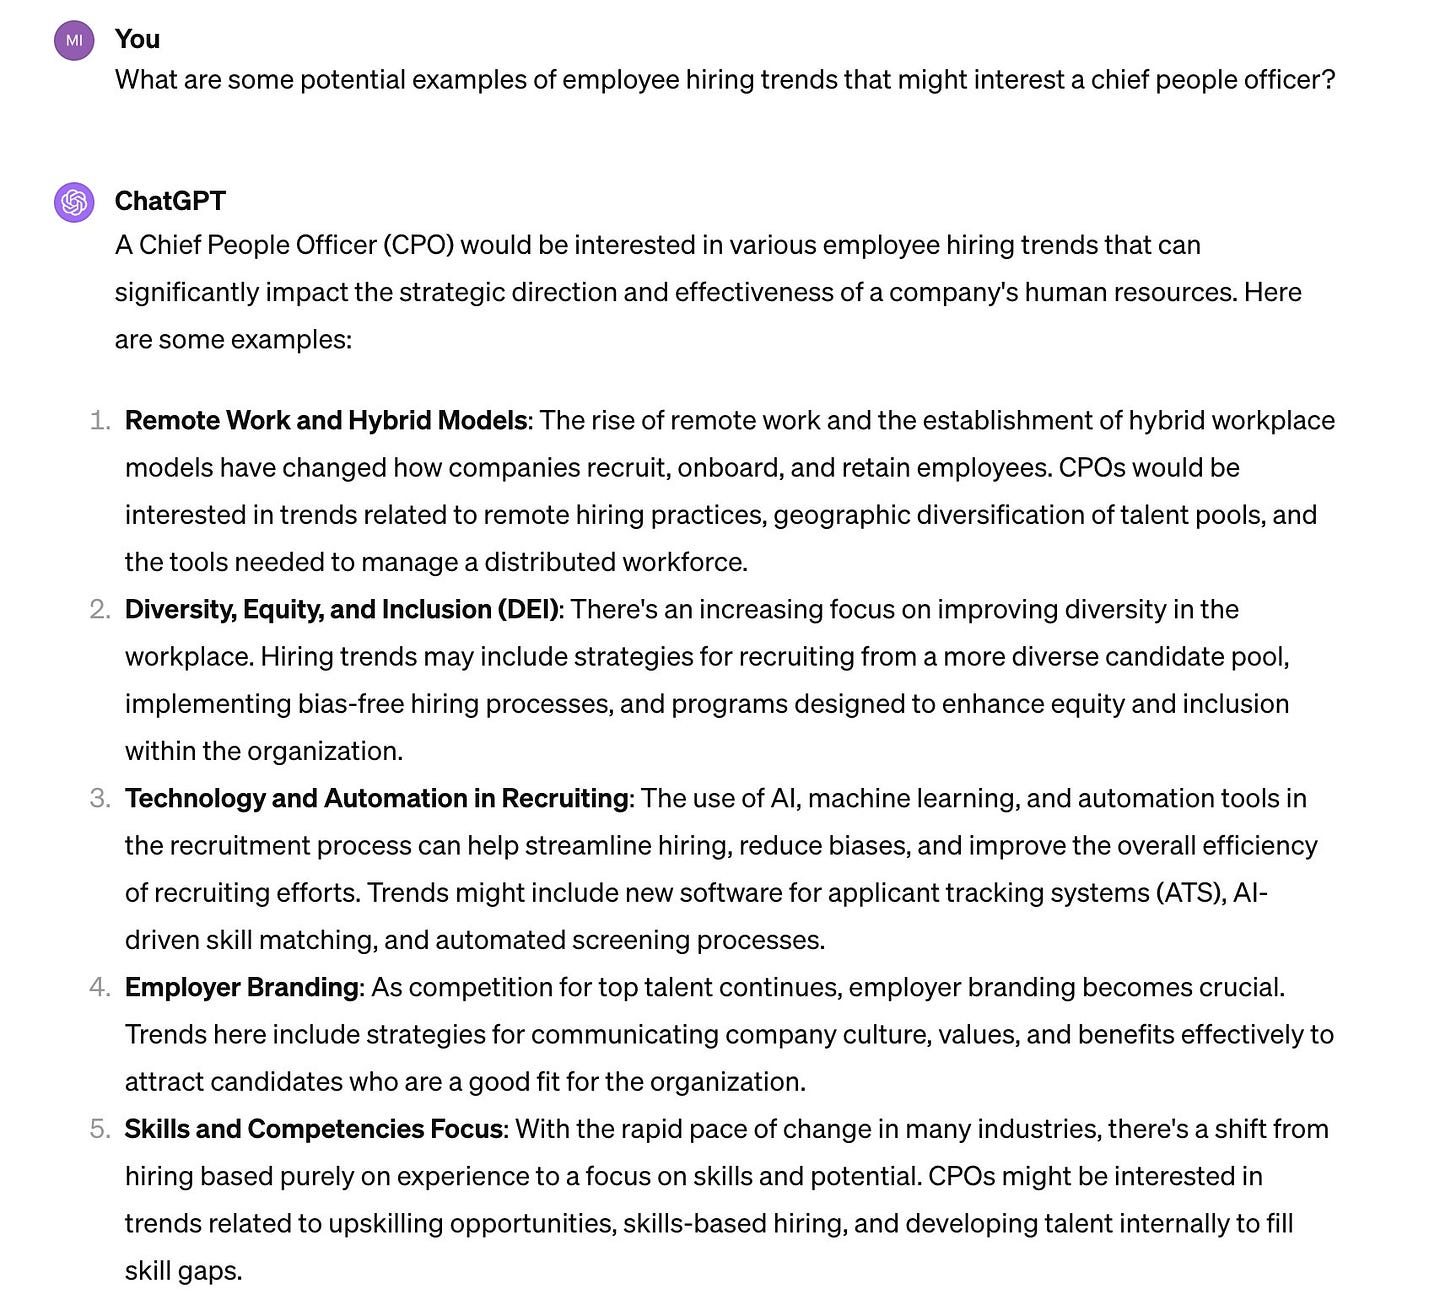
In my current role I have to design a lot of charts since I work on an analytics product. Before ChatGPT in order to move quickly I would just make up the data and charts but then my designs don’t look or feel realistic since it’s not telling an actual story. I've found ChatGPT helpful in helping think of potential stories to tell based on what I'm looking for. Here’s an example:
As you see in the image, ChatGPT provides different stories I can tell around hiring trends that might interest a Chief People Officer. I might pick an example from here or what happens is usually when I read these, some ideas come to me that I proceed with. From there I’ll start getting some charts generated.
Chart generation
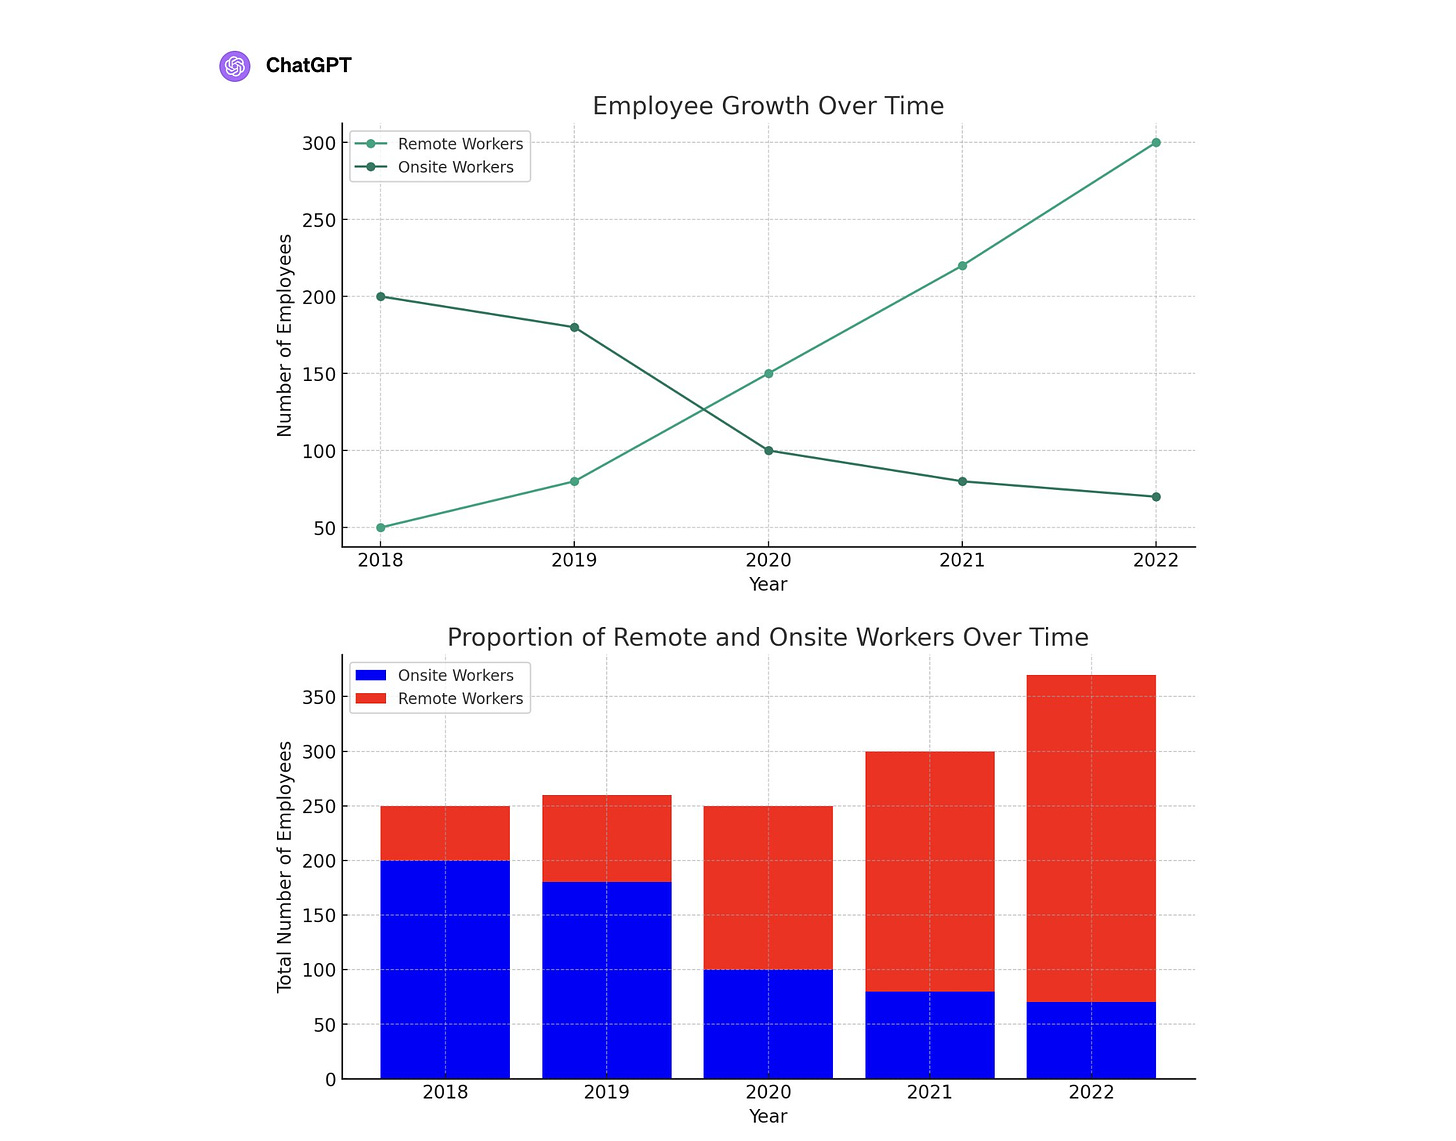
Once I have the story to tell, I then ask ChatGPT to generate a few charts using placeholder data that tells the story effectively. In other words ChatGPT can help you identify the charts that use best practices that help make the charts easy to understand for your users. This might be new to some of you reading this, but yes you read that correctly, ChatGPT actually outputs charts, it’s incredible.
Here’s some examples from ChatGPT:
You can ask for more chart types, as well as ask for adjustments made to the charts such as adjusting the colors and more but in my current workflow this is enough since I do the rest in Figma.
Redesigning the charts in Figma
Since I now have an idea of what I want my chart to look like with a clear story based on the data. I then copy and paste the charts over to Figma and I then redesign the charts to match the visual design of the app.
Asking ChatGPT for the data
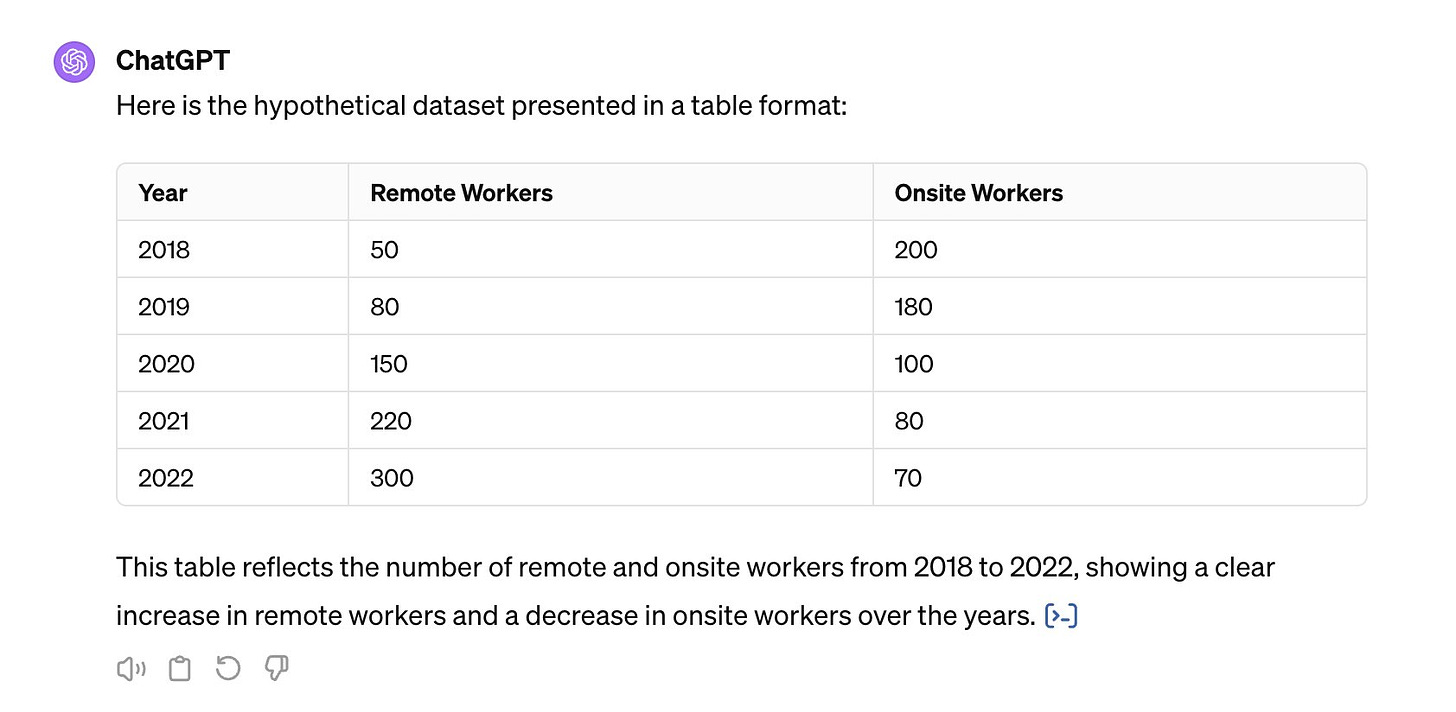
You can also ask ChatGPT to output the data in a table format in case you’re curious about the data or if you need the data in order to design your own tables.
Asking ChatGPT to explain your charts
Another workflow I find helpful is when I do design the charts from scratch within Figma, I like to copy and paste the charts into ChatGPT and ask it to explain the chart to me. If I find that ChatGPT explains the chart effectively, that’s a strong data point that the chart I design makes sense. If not, it’s an indicator that perhaps I need to revisit my chart design in order to tell the story more effectively.
Some learnings
Through this new workflow, some learnings and observations:
I find that my designs look more realistic with charts that convey an actual story instead of just quickly mocking up some fake charts
It’s really helpful to get ideas into the types of stories I want to tell with the charts, many times I might not even end up using the examples from ChatGPT, but the initial ideas help me think of some new ideas
Getting actual charts generated in ChatGPT and then copy and pasting over to Figma to then redesign to match the visual design of the app has sped up my chart design workflow tremendously
I’ve uploaded some very complex looking charts to ChatGPT and it’s very impressive how ChatGPT is able to explain the charts
Thanks for reading! I hope you find this helpful. If you have any ChatGPT tips, reach out to me on Twitter I’d love to learn more.


